I’ve loved sudoku ever since I first found out about it several years ago. Because I do so much in LaTeX these days, I wanted to figure out an easy way to typeset Sudoku grids using Tikz, with the thought that I might write some tutorials down the road.
As it turns out, there is already a package that does this: the sudoku package. This is a great package, but for my purposes, it had two limitations. First, you have to write quite a bit of code for each square in the grid, like this:
\begin{sudoku}
|2|5| | |3| |9| |1|.
| |1| | | |4| | | |.
|4| |7| | | |2| |8|.
| | |5|2| | | | | |.
| | | | |9|8|1| | |.
| |4| | | |3| | | |.
| | | |3|6| | |7|2|.
| |7| | | | | | |3|.
|9| |3| | | |6| |4|.
\end{sudoku}
That’s not terribly onerous (copy and paste could be your friend here), but it’s a lot of code to deal with. Second, it does not have a way to shade a particular square in the grid, which is something you might want to do if you are writing tutorials.
(I should point out that there is also the sudokubundle package, which is actually three packages: one that allows you to typeset puzzles from an input file, another one that attempts to find a solution to a specified puzzle, and a third that generates puzzles. I have not played around with this one at all, other than to find out that it also lacks a way to shade a given cell in the grid. For more information on this package, please visit “Sudoku Solvers“.)
Contents
Tikz to the Rescue!
For me, the obvious way to do this was to use Tikz, because all we are really drawing is a square grid and then adding a bunch of nodes to place our numbers. (Yes, I could do this with a table, but you should use tables for tabular data, which this really isn’t. We’re not organizing or summarizing data here.)
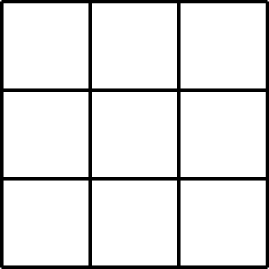
A sudoku grid is a 9×9 grid (and thus, with 81 cells), but that grid is broken down into nine 3×3 subgrids that are usually indicated by heavier lines. So we’ll assume a 9×9 grid for Tikz, and begin by outlining our nine subgrids using a heavy line for every third line:
\begin{tikzpicture}[x=5mm,y=5mm]
% Thick horizontal lines
    \draw [ultra thick](0,0)--(9,0);
    \draw [ultra thick](0,3)--(9,3);
    \draw [ultra thick](0,6)--(9,6);
    \draw [ultra thick](0,9)--(9,9);
% Thick vertical lines
    \draw [ultra thick](0,0)--(0,9);
    \draw [ultra thick](3,0)--(3,9);
    \draw [ultra thick](6,0)--(6,9);
    \draw [ultra thick](9,0)--(9,9);
\end{tikzpicture}
That gives us our subgrids:
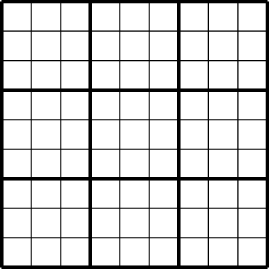
Now we can add our thinner lines that delineate individual cells, making our code look like this:
\begin{tikzpicture}[x=5mm,y=5mm]
% Thick horizontal lines
    \draw [ultra thick](0,0)--(9,0);
    \draw [ultra thick](0,3)--(9,3);
    \draw [ultra thick](0,6)--(9,6);
    \draw [ultra thick](0,9)--(9,9);
% Thick vertical lines
    \draw [ultra thick](0,0)--(0,9);
    \draw [ultra thick](3,0)--(3,9);
    \draw [ultra thick](6,0)--(6,9);
    \draw [ultra thick](9,0)--(9,9);
% Thin horizontal lines
    \draw (0,1)--(9,1);
    \draw (0,2)--(9,2);
    \draw (0,4)--(9,4);
    \draw (0,5)--(9,5);
    \draw (0,7)--(9,7);
    \draw (0,8)--(9,8);
% Thin vertical lines
    \draw (1,0)--(1,9);
    \draw (2,0)--(2,9);
    \draw (4,0)--(4,9);
    \draw (5,0)--(5,9);
    \draw (7,0)--(7,9);
    \draw (8,0)--(8,9);
\end{tikzpicture}
And now we have our complete grid of nine subgrids, each containing 9 cells, for a total of 81 cells:
Note: I want to call out a couple of things here. The first is that I’m using comments fairly liberally. Comments are free, and I encourage you to use them often. (Our code may seem fairly obvious to us, but it may not be to other people, especially beginners. And I can almost guarantee that while I may remember things tomorrow, I probably won’t remember them in a year. Use comments.)
The second is that Tikz has a gridspace that is automatically 1 centimeter in size. That’s a little large for my purposes, so I am adding the [x=5mm,y=5mm] option to reduce that size to half the default. I could also use the scale option, but that scales everything in the Tikz drawing, which would make the numbers too small. I really just want to reduce the distance between lines here, and not anything else.
Adding Numbers
Because we have a 9×9 grid based on Cartesian coordinates, it’s pretty easy to identify where are nodes are. Take a look at this diagram:
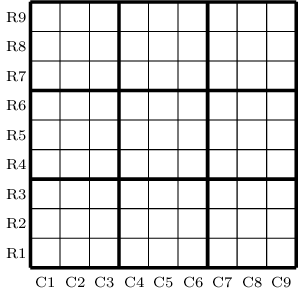
We can see that the bottom-left cell has the coordinates (0,0), (0,1), (1,1), and (1,0) at its four corners. Therefore, to place a number in the middle of that cell, we can place a node at (0.5,0.5). All of our nodes will be placed similarly. For example, all the nodes in C1 will have an x coordinate of 0.5, all the nodes in C2 will have an x coordinate of 1.5, and so on. Likewise, all the nodes in R1 will have a y coordinate of 0.5, all the the nodes in R2 will have a y coordinate of 1.5, and so on. Finally, the node in R9C9 will have coordinates of (8.5,8.5).
Putting it all together now, to generate this grid:
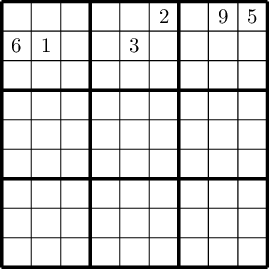 our full code would look like this:
\begin{tikzpicture}[x=5mm,y=5mm]
% Thick horizontal lines
    \draw [ultra thick](0,0)--(9,0);
    \draw [ultra thick](0,3)--(9,3);
    \draw [ultra thick](0,6)--(9,6);
    \draw [ultra thick](0,9)--(9,9);
% Thick vertical lines
    \draw [ultra thick](0,0)--(0,9);
    \draw [ultra thick](3,0)--(3,9);
    \draw [ultra thick](6,0)--(6,9);
    \draw [ultra thick](9,0)--(9,9);
% Thin horizontal lines
    \draw (0,1)--(9,1);
    \draw (0,2)--(9,2);
    \draw (0,4)--(9,4);
    \draw (0,5)--(9,5);
    \draw (0,7)--(9,7);
    \draw (0,8)--(9,8);
% Thin vertical lines
    \draw (1,0)--(1,9);
    \draw (2,0)--(2,9);
    \draw (4,0)--(4,9);
    \draw (5,0)--(5,9);
    \draw (7,0)--(7,9);
    \draw (8,0)--(8,9);
% Nodes
    \node at (0.5,7.5) {6};
    \node at (1.5,7.5) {1};
    \node at (4.5,7.5) {3};
    \node at (7.5,8.5) {9};
    \node at (8.5,8.5) {5};
    \node at (5.5,8.5) {2};
\end{tikzpicture}
Adding Shading
Because we are using Tikz, adding shading to a particular cell is fairly straightforward: we just need to define a path, tell it what color we want it to be filled with, select a line width of 0mm (because we already have lines), and then list the four coordinates of the cell we want to shade. For example, to shade the cell in R8C7 light grey, we could load the ninecolors package and use this code:
\path [fill=gray8, line width=0mm] (6,7) -- (7,7) -- (7,8) -- (6,8);
And we get this grid:
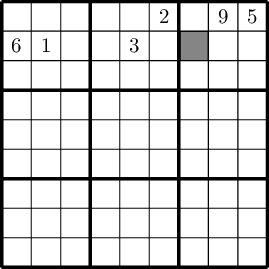 The important thing to note here is that we must define any shading before we draw our grid. In other words, that
 path command to fill a square must come before all the draw commands that actually draw the grid. If not, the grey square rests on top of our grid, and partially obliterates the lines, as we can see here:
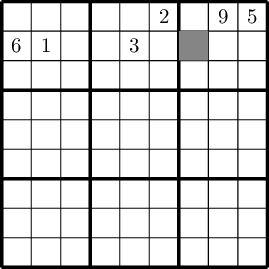
Remember that Tikz draws things in the order you define them, and each thing it draws is drawn on top of whatever it has already drawn. We aren’t really filling a grid that we have already drawn; rather we are drawing a completely new square and filling it in. We could just define a line thickness for our filled path, but that would become complicated because some of our lines are heavier than others. It’s easier (and faster) to just Occam our way of this and draw our filled paths first.
Summary
To put it all together, our full code now looks like this:
\begin{tikzpicture}[x=5mm,y=5mm]
% Fills (must go first to put behind the grid)
    \path [fill=gray8, line width=0mm] (6,7) -- (7,7) -- (7,8) -- (6,8);
% Thick horizontal lines
    \draw [ultra thick](0,0)--(9,0);
    \draw [ultra thick](0,3)--(9,3);
    \draw [ultra thick](0,6)--(9,6);
    \draw [ultra thick](0,9)--(9,9);
% Thick vertical lines
    \draw [ultra thick](0,0)--(0,9);
    \draw [ultra thick](3,0)--(3,9);
    \draw [ultra thick](6,0)--(6,9);
    \draw [ultra thick](9,0)--(9,9);
% Thin horizontal lines
    \draw (0,1)--(9,1);
    \draw (0,2)--(9,2);
    \draw (0,4)--(9,4);
    \draw (0,5)--(9,5);
    \draw (0,7)--(9,7);
    \draw (0,8)--(9,8);
% Thin vertical lines
    \draw (1,0)--(1,9);
    \draw (2,0)--(2,9);
    \draw (4,0)--(4,9);
    \draw (5,0)--(5,9);
    \draw (7,0)--(7,9);
    \draw (8,0)--(8,9);
% Nodes
    \node at (0.5,7.5) {6};
    \node at (1.5,7.5) {1};
    \node at (4.5,7.5) {3};
    \node at (7.5,8.5) {9};
    \node at (8.5,8.5) {5};
    \node at (5.5,8.5) {2};
\end{tikzpicture}
Macros to the Rescue!
So far, I have everything I want: an easily defined grid, easy to locate nodes, and a fairly easy way to shade in cells. But as you can see, it’s still a lot of code, and while I can copy and paste without too much trouble, copy and paste is responsible for a lot of what’s wrong with the world, since we tend to copy the wrong things and then paste them in the wrong place.
The solution here is pretty obvious: let’s turn these things into macros. Macros not only save us a lot of typing, they also make it easy to be uniform throughout our document. If I decide that I don’t like how something is formatted, I only need to alter the macro, instead of going through my entire document and altering each and every instance of my code, and risking missing one or more of them.
The basic syntax for creating LaTeX macros goes like this:
\newcommand{\<name of new command>}[number of arguments]{<definition of new command>}
Because my first name starts with the letter “k” I like to start all my macros with the same letter so that I can easily identify and remember them.
The Grid Macro
Let’s start by defining a new command—\kgrid— that will draw our grid for us:
% Draw a sudoku grid
\newcommand{\kgrid}{
% Thick horizontal lines
    \draw [ultra thick](0,0)--(9,0);
    \draw [ultra thick](0,3)--(9,3);
    \draw [ultra thick](0,6)--(9,6);
    \draw [ultra thick](0,9)--(9,9);
% Thick vertical lines
    \draw [ultra thick](0,0)--(0,9);
    \draw [ultra thick](3,0)--(3,9);
    \draw [ultra thick](6,0)--(6,9);
    \draw [ultra thick](9,0)--(9,9);
% Thin horizontal lines
    \draw (0,1)--(9,1);
    \draw (0,2)--(9,2);
    \draw (0,4)--(9,4);
    \draw (0,5)--(9,5);
    \draw (0,7)--(9,7);
    \draw (0,8)--(9,8);
% Thin vertical lines
    \draw (1,0)--(1,9);
    \draw (2,0)--(2,9);
    \draw (4,0)--(4,9);
    \draw (5,0)--(5,9);
    \draw (7,0)--(7,9);
    \draw (8,0)--(8,9);
}
Now whenever I want to draw a grid, instead of writing 26 lines, I can just write one: \kgrid and my empty sudoku grid is ready.
The Node Macro
The macro for our node will require three arguments. The first two will describe the coordinates of where we want to place it, and the third one will describe what we are placing in that node. It looks like this:
\newcommand{\knode}[3]{\node at (#1,#2) {#3};}
The [3] tells LaTeX that this macro will have three arguments; thus we must pass three arguments, each in a separate set of curly brackets, when invoking it. An example would look like this:
\knode{0.5}{7.5}{6}
which is the same as using this full notation:
\node at (0.5,7.5) {6};
I admit, we’re not saving a lot of typing here, but we are saving some, and that does eventually add up over time.
The Fill Macro
The fill macro will also take three arguments. The first two are the coordinates of the lower left corner of the cell we want to fill. In other words, if we wanted to fill the square at the R1C1 location, we would pass zero for both these arguments, as its lower left coordinate is at the origin.
The third argument is for which shade of grey I am using, based on the ninecolors package. (I like this package because I rarely need specific colors; I usually just need both lighter and darker versions of a given color and this package is the simplest way to do that.) I could add a fourth argument that would allow me to select different colors, rather than just grey, but because I usually print everything on a laser printer, that’s a moot point for me. But it would be easy enough to do.
Anyway, here’s our fill macro:
\newcommand{\kfill}[3]{\draw [fill=gray#3, line width=0mm] (#1,#2) rectangle +(1,1);}
Note the rectangle +(1,1) at the end. This is telling Tikz to start at the coordinate we designated with (#1,#2) and draw a rectangle that ends one unit to the right and one unit up of our starting point. This saves us from having to do a lot of tricky math in our macro. Thus, writing
\kfill{6}{7}{8}
is the same as writing
\path [fill=gray8, line width=0mm] (6,7) -- (7,7) -- (7,8) -- (6,8);
Now that does save us quite a bit of typing!
Putting it All Together
I think I’ve given you everything you need here to add this kind of LaTeX + Tikz magic to your own documents. Let’s take a look at what it takes to draw this figure again, first without macros, and then with macros:
Our Code, Both Ways:
\begin{tikzpicture}[x=5mm,y=5mm]
% Fills (must go first to put behind the grid)
    \path [fill=gray8, line width=0mm] (6,7) -- (7,7) -- (7,8) -- (6,8);
% Thick horizontal lines
    \draw [ultra thick](0,0)--(9,0);
    \draw [ultra thick](0,3)--(9,3);
    \draw [ultra thick](0,6)--(9,6);
    \draw [ultra thick](0,9)--(9,9);
% Thick vertical lines
    \draw [ultra thick](0,0)--(0,9);
    \draw [ultra thick](3,0)--(3,9);
    \draw [ultra thick](6,0)--(6,9);
    \draw [ultra thick](9,0)--(9,9);
% Thin horizontal lines
    \draw (0,1)--(9,1);
    \draw (0,2)--(9,2);
    \draw (0,4)--(9,4);
    \draw (0,5)--(9,5);
    \draw (0,7)--(9,7);
    \draw (0,8)--(9,8);
% Thin vertical lines
    \draw (1,0)--(1,9);
    \draw (2,0)--(2,9);
    \draw (4,0)--(4,9);
    \draw (5,0)--(5,9);
    \draw (7,0)--(7,9);
    \draw (8,0)--(8,9);
% Nodes
    \node at (0.5,7.5) {6};
    \node at (1.5,7.5) {1};
    \node at (4.5,7.5) {3};
    \node at (7.5,8.5) {9};
    \node at (8.5,8.5) {5};
    \node at (5.5,8.5) {2};
\end{tikzpicture}
and with macros:
\begin{tikzpicture}[x=5mm,y=5mm]
\kfill{6}{7}{8}
\kgrid
\knode{0.5}{7.5}{6}
\knode{1.5}{7.5}{1}
\knode{4.5}{7.5}{3}
\knode{6.5}{1.5}{7}
\knode{6.5}{4.5}{4}
\knode{7.5}{8.5}{9}
\knode{8.5}{6.5}{2}
\knode{8.5}{8.5}{5}
\end{tikzpicture}
I think you’ll agree with me that macros are the way to go!
If you have any questions, comments, or ways that this could be improved, please drop a comment down below. Thanks for reading!
https://techblog.kjodle.net/2025/04/19/typesetting-sudoku-grids-in-latex/
